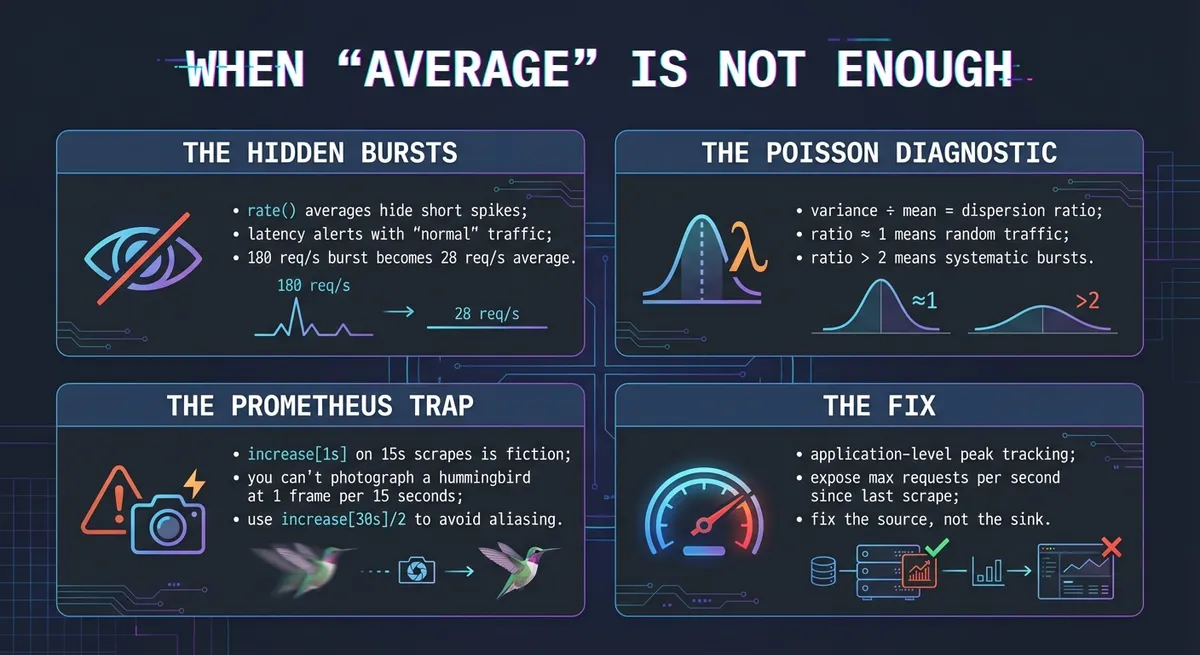
When 'Average' is not enough
- Stefano
- Backend , Observability
- 26 Dec, 2025
The scenario below is fictional, but it’s rooted in real problems I’ve encountered. I’ve found that wrapping technical concepts in a narrative makes them stick better—both for readers and for my future self. The gotchas around Prometheus resolution limits and the Poisson distribution diagnostics are very much real, and worth understanding before you hit them in production.
Last month, our document processing service started throwing latency alerts. Not constantly—just enough to be annoying. The dashboard showed a comfortable 45 requests/second average, well below our tested capacity of 60 req/s. So why were we seeing spikes?
Turns out, we were asking the wrong question. The average was fine. The distribution was the problem.
The Setup
We run a document ingestion service that processes incoming files, extracts metadata, and queues them for indexing. It’s a fairly typical Jakarta EE application sitting behind a load balancer. Our SLO (Service Level Objective) says 95% of requests should complete within 200ms. Standard Prometheus setup: 15-second scrape interval, Grafana dashboards with the usual rate(...[1m]) panels.
The service had been running smoothly for months. Then, without any deployment or traffic increase, we started breaching SLO about 2-3 times per hour. Our monitoring showed:
- Average requests/second: 45
- p99 latency during normal operation: 180ms
- p99 latency during spikes: 900ms+
We hadn’t changed anything. Traffic volume was the same. What was going on?
The Naive Analysis
Our first instinct was to look at the request rate graph. Prometheus query:
rate(http_requests_total{service="doc-processor"}[1m])The graph showed a fairly steady line hovering around 45 req/s. Nothing suspicious. We checked for memory leaks, GC pauses, database connection pool exhaustion—the usual suspects. All clean.
We stared at the dashboard for a while. The request rate was flat. Latency was spiking. It didn’t make sense.
Why We Couldn’t See the Spikes
Here’s something that seems obvious in retrospect but tripped us up: rate() averages over its window. Our dashboard used a 1-minute window with a 15-second scrape interval.
Imagine what happens with bursty traffic:
One minute of real traffic:- 57 seconds at ~20 req/s = 1140 requests- 3 seconds at ~180 req/s = 540 requests- Total: 1680 requests
What rate(...[1m]) reports: 1680 / 60 = 28 req/sThe burst gets averaged into a gentle bump. On a graph showing 0-100 req/s, the line wobbles between 25 and 35. Nothing alarming. Meanwhile, those 3 seconds at 180 req/s are enough to saturate the thread pool and send latency through the roof.
The latency graph caught it because p99 is designed to surface outliers—even if only 1% of requests suffered, we’d see it. But the request rate? Smoothed into oblivion.
We could have used max_over_time(rate(...[10s])[1m]) to catch peaks, but we didn’t have that panel. And even if we had, it would have shown that spikes exist, not why or how often.
Then someone asked: “What if we stop looking at the rate and start looking at the distribution?”
Thinking About Traffic as a Random Process
Here’s the mental model that helped us. Imagine requests arriving at your server. If they arrive independently of each other (one user’s request doesn’t influence when another user’s request arrives) and at a constant average rate, then the number of requests in any given second follows a Poisson distribution.
The Poisson distribution has one parameter: λ (lambda), which is both the mean and the variance. For our service, if traffic were truly Poisson with λ = 45, we’d expect:
- Mean requests per second: 45
- Variance: 45
- Standard deviation: √45 ≈ 6.7
So in a “normal” second, we’d see roughly 45 ± 13 requests (within two standard deviations). Occasionally we’d see 60+, but rarely.
The probability of seeing exactly k requests in a second is:
And the probability of exceeding our capacity (say, 60 requests) would be:
About 1 in 90 seconds—roughly once every 1.5 minutes. Annoying, but predictable.
But here’s the key insight: this math only works if the traffic actually follows a Poisson distribution. And there’s a simple diagnostic.
The Dispersion Ratio
In statistics, dispersion refers to how spread out values are around the mean. For count data like “requests per second,” we measure this with the dispersion ratio (also called the Index of Dispersion or Variance-to-Mean Ratio):
For a Poisson distribution, variance equals the mean (both equal λ), so the dispersion ratio is exactly 1. This gives us a diagnostic:
- Ratio ≈ 1: Traffic behaves like independent random arrivals (Poisson-like)
- Ratio > 1 (overdispersed): Traffic is bursty—requests cluster together more than random chance would predict
- Ratio < 1 (underdispersed): Traffic is smoother than random—something is artificially regulating the flow
If your dispersion ratio is significantly above 1, your traffic is bursty, and standard capacity planning based on averages will underestimate your peak load.
The Measurement Problem
Here’s where we hit a wall. We wanted to measure per-second request counts to compute variance. The naive approach would be:
# DON'T DO THIS - it doesn't work as expectedincrease(http_requests_total{service="doc-processor"}[1s])This is a trap. Prometheus is a sample-based system, not an event log. With a 15-second scrape interval, Prometheus has no idea what happened between scrapes. When you ask for increase[1s], it looks at the two nearest samples (15 seconds apart), calculates the delta, and extrapolates it down to 1 second.
If 150 requests arrived in a 15-second window:
Reality: 0, 0, 0, 150 (spike), 0, 0, 0...increase[1s]: 10, 10, 10, 10, 10, 10, 10... (smoothed)The query performs exactly the smoothing we were trying to avoid. You cannot detect a 1-second burst with 15-second sampling resolution. It’s like trying to photograph a hummingbird with a camera that takes one frame every 15 seconds.
The Solution: Application-Level Instrumentation
To catch sub-scrape-interval bursts, we needed the application itself to track them. We added a simple metric to our service:
public class RequestBurstTracker { // LongAdder handles high-concurrency better than AtomicInteger // (reduces CPU cache contention by maintaining per-thread counters) private final LongAdder currentSecondCount = new LongAdder(); private final AtomicInteger peakSinceLastScrape = new AtomicInteger(0); private final AtomicInteger lastSecondCount = new AtomicInteger(0);
private final ScheduledExecutorService scheduler = Executors.newSingleThreadScheduledExecutor();
public RequestBurstTracker() { // Every second, snapshot the count and reset scheduler.scheduleAtFixedRate(() -> { int count = (int) currentSecondCount.sumThenReset(); lastSecondCount.set(count); peakSinceLastScrape.updateAndGet(peak -> Math.max(peak, count)); }, 1, 1, TimeUnit.SECONDS); }
public void recordRequest() { currentSecondCount.increment(); }
// Called by Prometheus scrape - returns and resets peak public int getPeakAndReset() { return peakSinceLastScrape.getAndSet(0); }
public int getLastSecondCount() { return lastSecondCount.get(); }}We exposed two Gauge metrics:
Gauge.builder("http_requests_peak_per_second", tracker, RequestBurstTracker::getPeakAndReset) .description("Peak requests in any 1-second window since last scrape") .register(registry);
Gauge.builder("http_requests_last_second", tracker, RequestBurstTracker::getLastSecondCount) .description("Requests in the most recent 1-second window") .register(registry);Now even with a 15-second scrape interval, Prometheus captures the highest 1-second burst that occurred in that window. We’re not asking Prometheus to infer data it doesn’t have—we’re giving it pre-computed peaks.
Computing the Dispersion Ratio
With our peak gauge in place, we could already see the bursts. But to quantify how bursty—and track whether fixes helped—we needed the dispersion ratio.
Here’s the thing: we don’t need 1-second resolution to detect burstiness. If batches dump 180 requests in 3 seconds every few minutes, the 15-second windows containing those bursts will show elevated counts compared to quiet windows. The dispersion ratio will still be high—just measured at coarser granularity.
Using standard Prometheus with 15-second scrapes, we computed dispersion over 15-second windows.
One gotcha: don’t use increase[15s] with a 15-second scrape interval. Due to slight jitter in scrape timing (15.1s, 29.9s, etc.), a window exactly matching your scrape interval might capture 1 sample or 2, causing aliasing artifacts—your graph looks like a sawtooth with gaps. Always use a window covering at least 2 scrapes:
-- Mean requests per 15-second window (safe: 30s window covers 2+ scrapes)avg_over_time( (increase(http_requests_total{service="doc-processor"}[30s]) / 2)[1h:15s])
-- Or equivalently, using rate:avg_over_time( (rate(http_requests_total{service="doc-processor"}[1m]) * 15)[1h:15s])
-- Variance over 15-second windowsavg_over_time( ((increase(http_requests_total{service="doc-processor"}[30s]) / 2) ^ 2)[1h:15s])-(avg_over_time( (increase(http_requests_total{service="doc-processor"}[30s]) / 2)[1h:15s])) ^ 2The key is that your increase[] window must be larger than your scrape interval to guarantee capturing at least two samples. Anything smaller is statistical fiction; anything exactly equal is a coin flip.
What We Found
After running the dispersion query over a few hours of traffic:
- Mean: ~675 requests per 15-second window (≈ 45 req/s)
- Variance: ~1890
- Dispersion ratio: 2.8
Now, here’s an important nuance: real-world web traffic is almost never perfectly Poisson. The Poisson model assumes events are truly independent—but when a user loads a page, they trigger multiple asset requests simultaneously. That’s not independent; it’s one action causing a cluster. So some overdispersion (ratio > 1) is normal.
But a ratio of 2.8 was extreme. This wasn’t organic user behavior—it smelled like a synthetic batch pattern.
| Ratio | What it typically means |
|---|---|
| 0.5 - 0.9 | Something is smoothing traffic (load balancer, rate limiter) or your service is saturated—blocking on a resource acts like a metronome, processing requests at a fixed rate |
| 0.9 - 1.5 | Reasonably random, organic traffic |
| 1.5 - 2.0 | Moderately bursty, worth investigating |
| > 2.0 | Highly bursty, likely a systematic cause |
Meanwhile, our http_requests_peak_per_second gauge confirmed the severity: peaks hitting 150-200 req/s, far beyond what the smoothed rate(...[1m]) showed.
Finding the Bursts
Now we knew what was happening—bursty traffic. But why?
With our http_requests_peak_per_second gauge in place, we could finally see the spikes:
http_requests_peak_per_second{service="doc-processor"}There it was: peaks hitting 150-200 req/s, completely invisible in our smoothed rate(...[1m]) view.
Why not just use max? You might wonder: if we have the peak metric, why bother with variance at all? Just alert when max is high.
The answer: max is noisy. A single outlier—one weird second where everything aligned—can trigger alerts for days on a max-based graph. Dispersion ratio is a statistical measure of how consistently clumpy traffic is over time. A high max with normal dispersion means “one-off spike.” A moderate max with high dispersion means “systematic burstiness.” The latter is what we had.
Next, we correlated spike times with request metadata. We added a temporary log line that fired whenever our 1-second counter exceeded 80, capturing the source IPs and request paths. The pattern emerged within an hour: a batch processing system upstream was dumping documents in waves every few minutes. Each “batch” contained 50-200 documents that all hit our service within 2-3 seconds.
The average was 45/s. But reality was more like: 20/s… 20/s… 20/s… 180/s… 20/s…
The Fix (and the Broader Lesson)
The immediate fix was straightforward: we worked with the upstream team to add jitter to their batch submissions, spreading the load over 30 seconds instead of 3.
Post-fix metrics:
- Mean: 44 req/s (basically unchanged)
- Variance: 51
- Dispersion ratio: 1.16
Much closer to Poisson. Our SLO breaches dropped to near zero.
What We Learned
rate() hides bursts. A 3-second spike at 180 req/s becomes a gentle wobble when averaged over a minute. Your dashboard might be lying to you. If latency is spiking but request rate looks flat, the problem is likely sub-minute bursts that get smoothed away.
Prometheus can’t see what it doesn’t sample. This was our biggest “aha” moment. With a 15-second scrape interval, increase[1s] doesn’t give you 1-second resolution—it gives you interpolated fiction. If you need sub-scrape-interval visibility, you need application-level instrumentation that pre-computes the metrics you care about (peaks, histograms, etc.).
The average is not enough. A service can be well under capacity on average and still buckle under traffic bursts. The variance tells you whether your traffic is smooth or spiky.
Poisson is a useful baseline, not gospel. Real web traffic is naturally bursty—page loads trigger multiple requests, users cluster around events. A dispersion ratio of exactly 1.0 is actually suspicious in production (it implies artificial smoothing). But how much overdispersion you see tells you whether it’s organic clustering or something systematic. Our ratio of 2.8 screamed “batch job,” not “normal users.”
Max is noisy; dispersion is diagnostic. A single outlier second can spike your max for days. Dispersion ratio tells you if burstiness is consistent—which is the signal you actually want for capacity planning.
Fixing the source beats scaling the sink. We could have thrown more instances at the problem. Instead, we fixed the bursty upstream behavior. Same average load, dramatically better tail latency.
Quick Reference: What We Run Now
Application-side instrumentation (the foundation):
// Gauge exposing peak 1-second burst since last scrapeGauge.builder("http_requests_peak_per_second", tracker, RequestBurstTracker::getPeakAndReset) .register(registry);Prometheus queries:
-- Standard rate (remember: this hides sub-minute bursts)rate(http_requests_total{service="doc-processor"}[1m])
-- Peak requests per second (from our custom gauge)http_requests_peak_per_second{service="doc-processor"}
-- Alert when peak consistently exceeds thresholdavg_over_time(http_requests_peak_per_second{service="doc-processor"}[10m]) > 80Dispersion ratio at scrape-interval resolution (valid with standard 15s scrapes):
-- The [1h:15s] syntax is a subquery: it evaluates the inner expression-- every 15s over the last hour, giving us a time series of 240 samples.-- avg_over_time then computes statistics over those samples.( avg_over_time( ((increase(http_requests_total{service="doc-processor"}[30s]) / 2) ^ 2)[1h:15s] ) - (avg_over_time( (increase(http_requests_total{service="doc-processor"}[30s]) / 2)[1h:15s] )) ^ 2)/avg_over_time( (increase(http_requests_total{service="doc-processor"}[30s]) / 2)[1h:15s])Alert on sustained burstiness:
-- Fires if 15-second windows show high dispersion over the last hour-- (ratio > 2 suggests systematic bursts, not random traffic)<dispersion_ratio_query_above> > 2Conclusion
Next time your service misbehaves despite “normal” traffic, don’t just check the average. Check the variance. And remember: you can only measure what you can see—if your scrape interval is coarser than your bursts, you’ll need to add application-level instrumentation to catch them.
The dispersion ratio won’t tell you why traffic is bursty, but it will tell you that it is, and how much. Sometimes that’s exactly the clue you need.
The Poisson distribution assumes events occur independently at a constant rate. Real traffic rarely meets this ideal—page loads cluster, users follow events, batch jobs dump requests. But Poisson gives you a baseline. When your dispersion ratio is close to 1, standard capacity planning math works. When it’s 2 or 3, something systematic is happening, and the fix might be upstream of your service entirely.